The History Books Are Wrong
Below this post is a model-based reconstruction of the labor implied by New England’s deforestation and stone-wall era. It takes the landscape as the fact, runs the math backward, and then compares that recomputed workload to the stories we inherited.
I stayed in my lane. New England. About 62,700 square miles. The era when the forest got shoved back and stone walls multiplied like they were printed.
I used AI to run the reverse accounting. How many hands. How much time. How much mass. What a year and a working life had to contain.
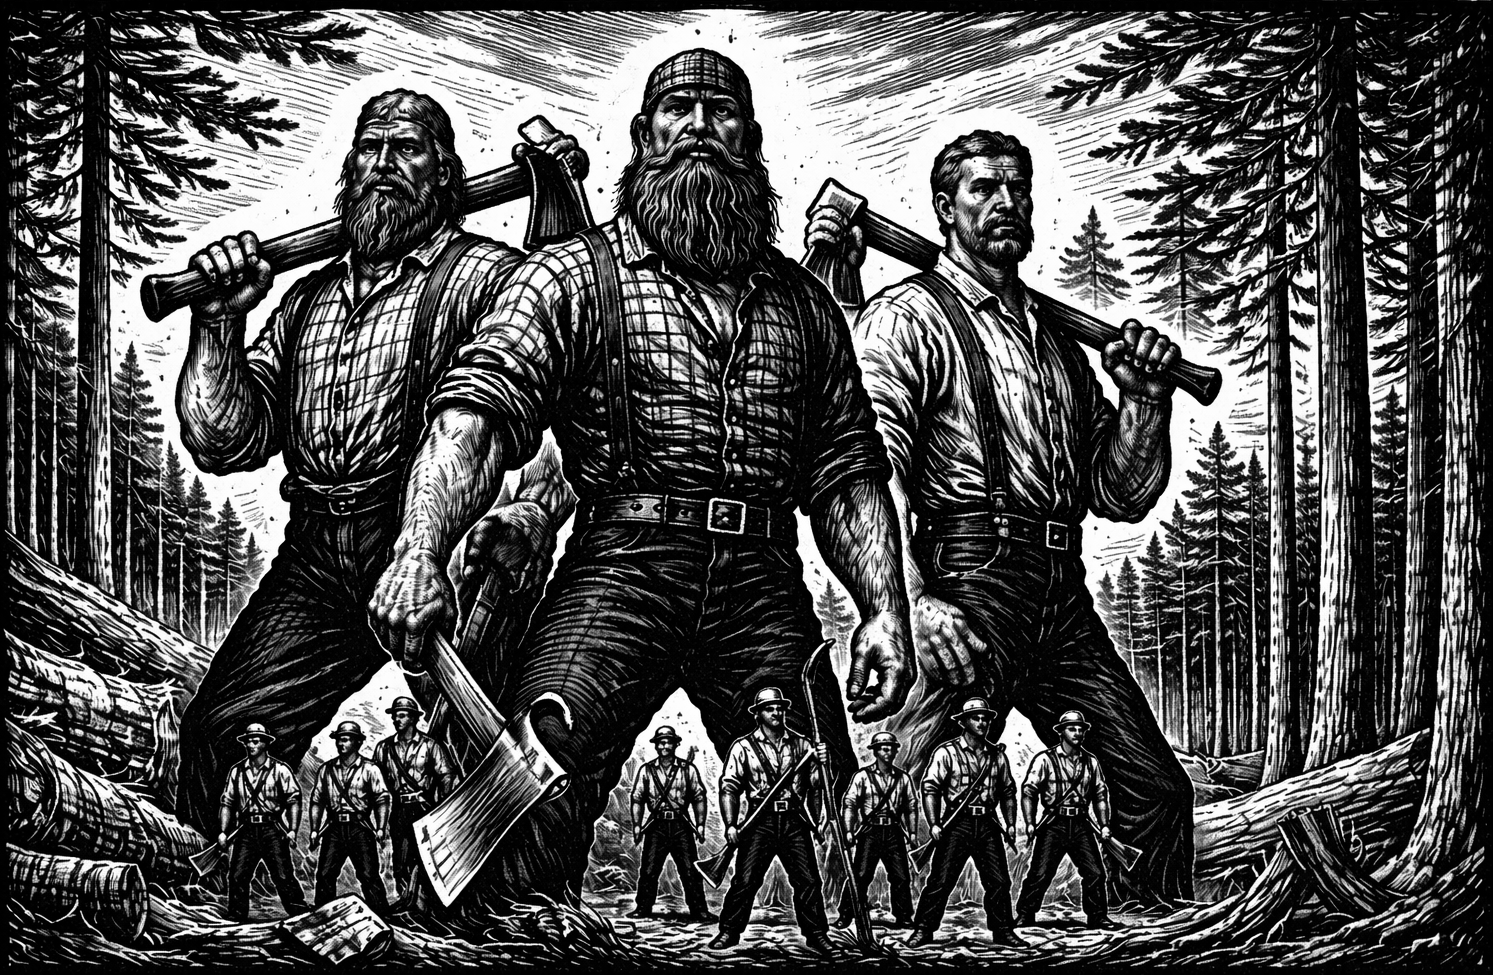
If the recomputation is even close, Paul Bunyan was not one guy with a blue ox.
He was a category.
Because to make the numbers work, each man had to carry a steady base load of felling, bucking, splitting, hauling, stacking, stump work, stone prying, dragging, placing, and wall building, while still farming, fixing, hunting, and keeping a household alive.
I have dropped plenty of trees and moved plenty of stone with modern equipment. That is why this bothers me. The implied story does not pencil out to my hands, my back, or my sense of time.
That is the contrast I cannot unsee. The written record reads like a polite summary. The recomputation reads like a load chart.
So yes, I’m going to say it plainly. History lies. Not always out of malice. Out of filtering. The record follows what gets written down and what gets kept. The landscape does not care about any of that.
Read the source below as an exhibit. Then decide which feels more real, the sentences that survived, or the mass that had to move.
Exhibit A
Muscle, Gravity, and the Deforestation of New England
If you want the source in its native form, here is the Google Doc.
IIn the Great Deforestation era, the simplest regional model says the machine ran on roughly 300,000 working men.
Across the long arc from 1700 to 1850, the per-man yearly share looks like this: about 69 cords of fuelwood handled, about 62 canopy trees felled, with a plausible range of 43 to 136, about 11 to 15 large stumps pushed through a real disposal pipeline, about 28 to 29 feet of stone wall added, and about 9 tons of stone placed into those walls.
Over a 30-year working lifetime, that becomes roughly 2,070 cords, roughly 1,900 canopy trees, with a plausible range of about 1,300 to 4,100, roughly 330 to 435 large stumps, about 850 to 880 feet of wall, about a sixth of a mile, and roughly 267 tons of stone moved into boundary.
The cohort size is the main lever. These figures assume 300,000 men. If the cohort was 200,000, every per-man figure rises by 50 percent. If the cohort was 400,000, every per-man figure falls by 25 percent.
A machine-man does not live these numbers as a spreadsheet. He lives them as a calendar. The work arrives in surges, and the seasons are tools.
Winter concentrates bulk movement. A cord is stacked volume, not a log. It means felling, bucking, splitting, stacking, then hauling on frozen ground that turns the woods into a road.
Spring makes the stone number appear. Nine tons per year is a steady stream of rock pried out, dragged to the edge, and re-dragged when frost heave brings new stone up. Twenty-eight feet of wall is repairs and extension, corners squared, gaps filled, a few feet at a time until it adds up.
Summer hides the canopy number inside everything else. Tree work comes in bursts, boundaries opened, stands thinned, big trunks taken when labor is available, while crops, animals, and tools refuse to wait.
Fall is where the stumps take their turn. Eleven to fifteen big stumps per year is staging, loosening, cutting roots, setting pulls, sometimes blasting, then hauling to piles when the ground turns hard enough to carry the weight. The stump is where time gets spent twice, extraction, then cleanup.
Those burdens were never the only burdens. The machine ran inside a life that still had to function. Mending harness, rebuilding tools, repairing fences that are not stone. Planting and harvest on immovable dates. Daily animal care. Homes and barns as ongoing construction. Hunting and fishing as protein logic and contingency. Illness, injury, and bad weather distorting the calendar rather than stopping it.
In other words, the ledger is not a man’s whole year. It is the load-bearing work that sat on top of everything else required to keep a household alive and a farm intact. The wall is the durable receipt.
The toolset was brutally simple. Axes and crosscut saws. Wedges, mauls, and froes. Chains, chokers, and skids. Levers, pry bars, stone boats, and sledges. Capstan pullers and rigging. Oxen and horses for traction. Walking speed work, amplified by animal power and leverage, limited by what hands, iron, wood, and time could endure.
New England did not drift into a new landscape. It was pushed. The Great Deforestation was a regional program of conversion and maintenance that ran for generations. The region cleared something like 60 to 80 percent of its land for fields and pasture at its peak, then held that openness long enough that forest became the exception rather than the default. The only way to do that without machines is to distribute the pain across farms, sons, hired hands, haulers, woods labor, and temporary crews assembled for the ugliest tasks.
Trees are the first gate. A canopy-density model tied to witness-tree and old-growth structure implies billions of canopy trees removed across the region. The point is not the exact number. The point is that clear cut of the oldest and largest is an arithmetic consequence of how much land became open and how many big trees a mature canopy holds per acre.
Then come the stumps, the part that refuses to compress. A stump is anchored, heavy, and stubborn, and it forces time into the equation. Land-clearing practice shows disposal as a pipeline staged across seasons and years, pulling, blasting when necessary, hauling, piling, burning, repeated cleaning. Winter becomes hauling season because hard ground can carry weight while other steps wait for thaw. That is why the large stump number matters more than all stumps. A clearing can create billions of stumps, but only a subset enters an organized disposal process. Even then, the implied count is still hundreds of millions regionally.
And then there is the stone, the slow adversary that keeps returning. The walls are the visible end state. Quarter-million miles of wall at peak is a regional lattice. If you accept the published mass estimate, it is also hundreds of millions of tons of rock moved into lines. Wall-building is only the final assembly. The real burden is decades of prying and moving stone to the margins so fields stop breaking tools and boundaries stop being negotiable.
When you walk the woods now and find a wall in the trees, you are not seeing decoration. You are seeing the last durable receipt from a machine that ran long enough, and hard enough, to clear a region and then hold it open before the forest returned.
More Questions
What changed in the translation from lived work to written record? Who had ink, paper, and leisure, and who had blisters and no reason to write?
Which parts of the machine leave durable receipts, and which parts dissolve? Stone walls persist. Meals, injuries, and exhaustion do not.
If the outputs are real, where did the calories come from? What did a normal day of eating look like in winter hauling season, not in a museum kitchen?
How much of the labor was farm family work, and how much was done by hired hands, seasonal crews, and men who do not show up in tidy local histories?
If the work arrived in bursts, what does that do to “average per year” numbers? What does an impossible average look like when it is really three brutal weeks repeated for decades?
What technologies are invisible because they are not machines? Frozen ground as road. Snow as skid system. Rivers as conveyor.
How much of “history” is a preference for what can be narrated? A battle, a sermon, a treaty, a famous man. How little is written about repetition, maintenance, and the small daily costs that actually changed the landscape?
If you can back-solve a past from constraints, what else can you back-solve? Population movement, fuel supply, tool failure rates, injury rates, livestock logistics.
When a model feels persuasive, what exactly is persuading you? The math. The tone. The completeness. The relief of having a coherent story.
What is the difference between a model and a myth? One uses numbers. One uses characters. Both compress.
Which do you trust more, and why? The artifact that survived. The reconstruction that fits. The story you already loved.
If the past was larger than the sentences that survived it, what else have we made small just to make it readable?
Possible Answers
Possible answers that do not require anyone to be ten feet tall
Uncounted workers. The history books track owners and institutions. The work often ran through hired hands, seasonal crews, river drivers, and lumber gangs. They produced outcomes, not paperwork. If your labor pool is larger than the “named and settled” population you carry in your head, the load per man drops fast.
Uncounted days. The averages read like a daily quota. The work did not show up evenly. It showed up in surges. A few winter hauling weeks can move more mass than months of fair weather. A few crew days on a wall can add the season’s footage. Flatten surges into yearly shares and it looks impossible.
Different transport physics. Frozen ground, snow, skids, sleds, and rivers change the math. Much of the mass did not get carried. It got slid, dragged, floated, rolled, and leveraged. If you imagine modern friction and modern logistics, the old outputs look like myth.
Tool and animal multiplication. Hand tools do not mean human-only. Oxen, horses, yokes, harness, skids, capstans, tackle, wedges, levers, and stone boats are force multipliers. The “machine” is the combination. The written record tends to mention the scene, not the mechanical advantage.
Selection bias in what survives. The record over-preserves what is narratable and named. It under-preserves repetition, maintenance, and low-status grind. That does not make it dishonest. It makes it incomplete. A wall in the woods is a durable receipt. The ten thousand small steps that made it are not.
Parameter sensitivity. The cohort size assumption is a lever. Change it and the per-man requirements swing hard. Same with canopy density, stump definitions, wall-mile estimates, and what counts as “disposed.” If the model is aggressive on a few inputs, it can drift into Bunyan territory without anyone lying.
Definition mismatch. “Large stump,” “canopy tree,” “wall mile,” “cleared land,” “removal,” “disposal pipeline.” Small definitional shifts create huge outcome differences. That is one of the simplest reasons a story and a model can disagree while describing the same world.
Hidden costs that push effort into the margins. Debt, rents, taxes, and winter feed costs drive urgency. So does risk. When failure means losing land or going hungry, output rises. Not because people are superhuman. Because the penalty function is real.
The simplest frame. The books preserve meaning. The model preserves mass. When they disagree, the mismatch is a clue about what got filtered out, not automatic proof that one side is fake.